
Seasons and Climate Chart Manufacturer,Supplier and Exporter in India
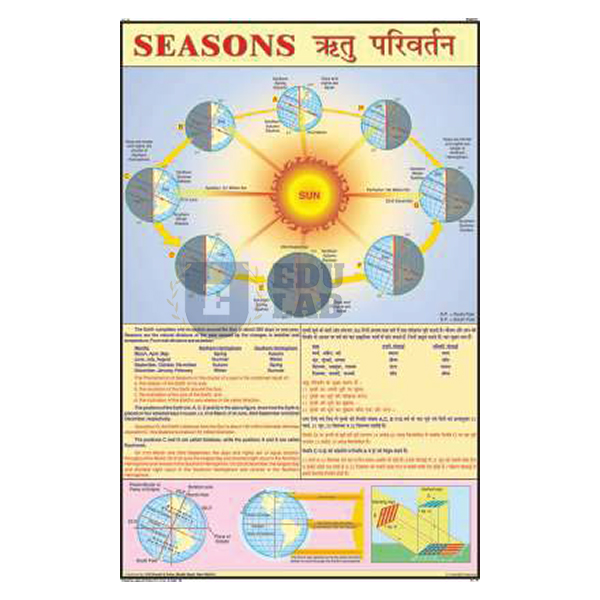
Product Code : EL-GC-10134
Lab Instruments Manufacturers manufactures the Seasons and Climate Chart in-house at our own India facility, supplying it to schools and colleges teaching geography, and as an OEM/private-label item to distributors and exporters across India and internationally.
What This Chart Covers
This chart explains how the Earth's tilt and orbit produce the seasons, and how seasonal change relates to regional climate patterns. It measures 50 x 75cm, printed in multicolour on 80 gsm map litho paper, laminated on both sides with hot-seal polyester film, and fitted with first-quality plastic rollers top and bottom. Available in English and Hindi.
Chart details
| Size | 50 x 75cm |
| Printing | multicolour |
| Paper | 80 gsm map litho paper |
| Lamination | hot-seal polyester film |
| Rollers | first-quality plastic rollers top and bottom |
| Languages | English and Hindi |
Typical Classroom Use
Schools and colleges use this chart to teach the causes of the seasons and their link to climate, and it is commonly studied alongside our Earth and Its Motions Chart and Pressure and Winds Chart.
Manufactured In-House
This chart is printed, laminated, and fitted with rollers at our own India production facility. Manufacturing in-house means our team controls print quality and durability at every stage, and can produce custom sizes, languages, or bulk classroom sets for a specific school order or export shipment without waiting on an outside supplier.
Frequently Asked Questions
What does this chart show?
How the Earth's tilt and orbit produce the seasons, and how seasonal change relates to regional climate patterns.
What languages is it available in?
English and Hindi.
Can this be supplied as an OEM/private-label order?
Yes, it can be produced and packed under a buyer's own brand name and item codes for distributors and exporters ordering in bulk.
Related Charts
Climate units usually combine this with Earth and Its Motions Chart, Factors That Affect Climate Chart, Day and Night Chart and Pressure and Winds Chart. All sit in Geography Charts, part of the Charts range.
Last updated: October 2026.


